Features
Browser panels
Native Chromium beside your terminals, with a one-key path from page to agent.
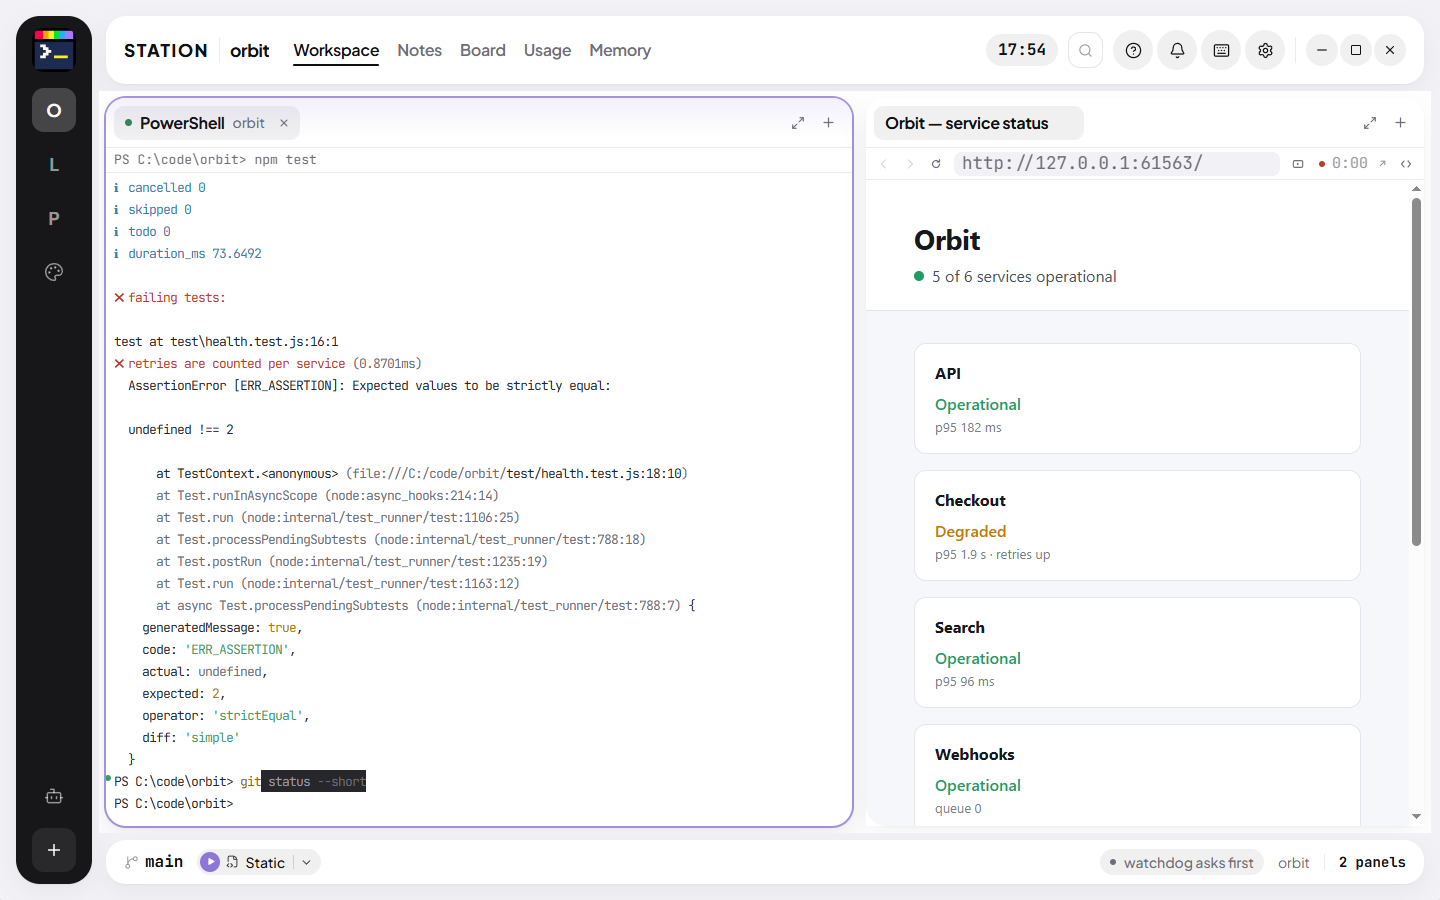
A browser panel is a real Chromium view docked into the layout: address bar, DevTools, downloads, find in page. What makes it Station’s is the bridge: a page’s errors, a marked-up capture of it, or the elements you point at go to an agent’s terminal in one keystroke.
- 1
- keystroke from a page’s errors to an agent’s terminal
- 1
- shared sign-in profile for every panel
- 7
- browser tools an agent can call through Station
1/3 · The page says what broke
The project runs in a real browser panel beside its terminal. When the page throws, the panel’s toolbar counts the console errors, so a failure shows without opening DevTools.
Recorded in Station, in a sample project · waits sped up
Hand a page to an agent
Ctrl+Shift+E sends the page’s console errors into a terminal, with third-party noise filtered out. Ctrl+Shift+S captures the page, opens it for annotation and sends the file’s path.
Point at what is wrong, and say why
Ctrl+Shift+X turns the page into a pointer. Click an element, write what is wrong with it, and do the same for the next one. Send puts every mark in the terminal: the element’s selector, its text, the styles that matter, the component and source line it came from when the page knows them, and a picture of it cropped at the moment you clicked. It lands at the prompt, unsent: the Enter is yours.
Tools for the agent
Through Station’s MCP server an agent can list, open and navigate panels, read a page, take a screenshot and read its console and network, limited to local and dev-server pages, because a panel’s profile carries your logins.
Two days, every feature, no card.